

The GDP performance sheets of major cities across the country for the first half of 2026 have been released.
In the first half of this year, the national total GDP reached 69.5704 trillion yuan, a year-on-year increase of 4.7%, and the overall economic foundation has remained stable.
Focusing on the top 10 cities by national GDP, their share of total economic output has risen again: The total GDP of the top 10 cities accounts for 24% of the national total, an increase of nearly 0.4 percentage points compared with the full year of 2025.
Projected to the real estate market, real estate enterprise investment and market demand are also converging to the core sectors of leading cities.
However, from the perspective of market performance, the divergent market trends among cities are still ongoing, some cities have taken the lead in recovering the replacement housing market, while others are still in the bottoming-out phase.
01
First, let’s look at the cities that firmly rank in the national top 10 in the first half of this year:
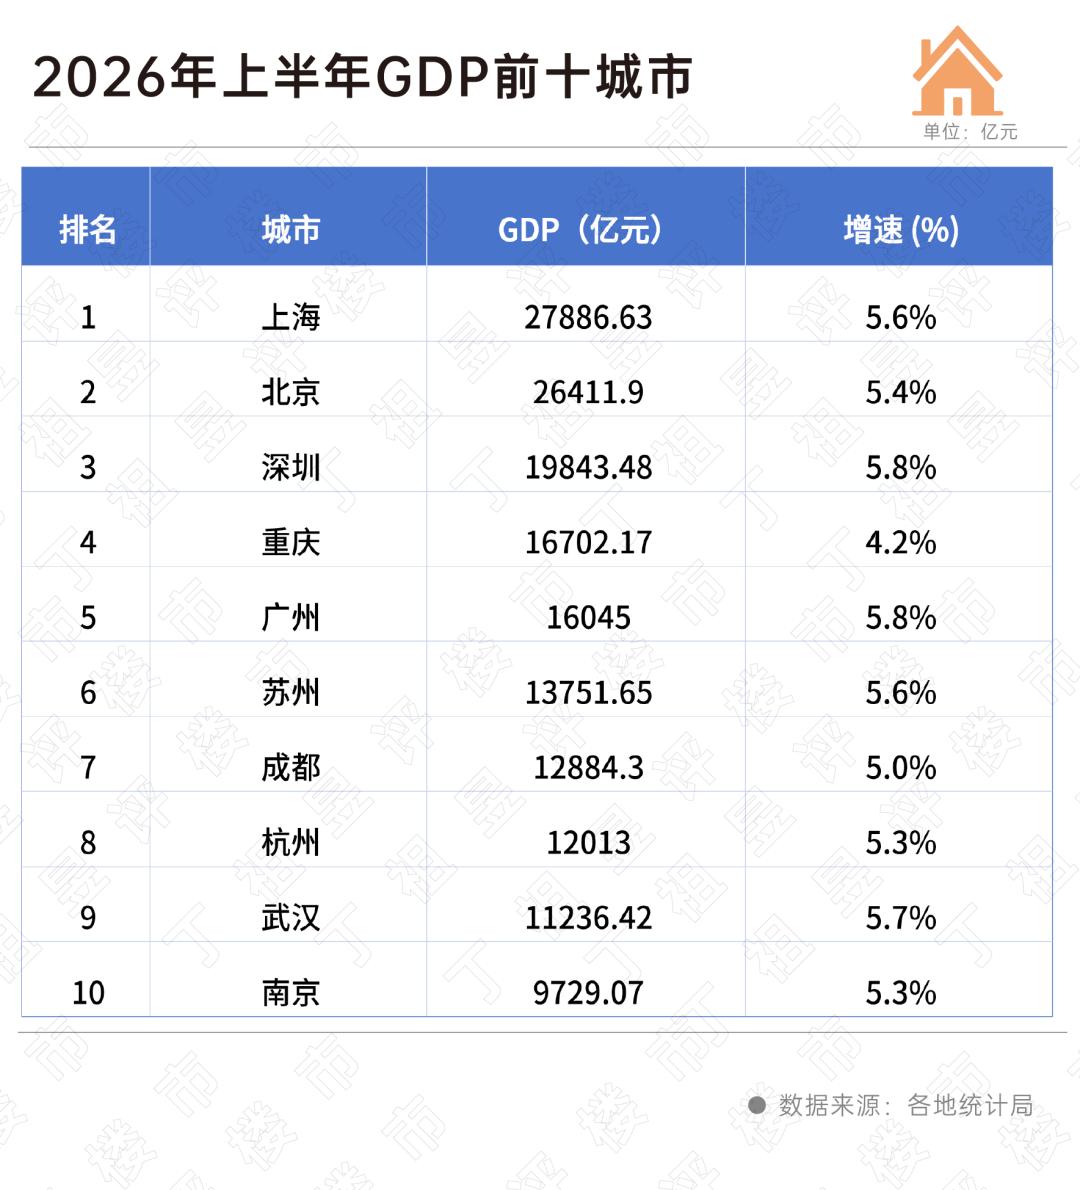
Shanghai, Beijing, Shenzhen, Chongqing, Guangzhou, Suzhou, Chengdu, Hangzhou, Wuhan, Nanjing.
In terms of total volume, the threshold for the top 10 is getting higher and higher. Except that Nanjing’s GDP in the first half of the year was 972.907 billion yuan, which is about to exceed 1 trillion yuan, the remaining 9 cities have all steadily reached the 1-trillion-yuan level. Shanghai remains the top city in GDP, with a GDP of 2.788663 trillion yuan in the first half of the year and a growth rate of 5.6%; Beijing ranks second only to Shanghai, with a total GDP exceeding 2 trillion yuan, reaching 2.64119 trillion yuan; Shenzhen, which ranks third, is just a step away from 2 trillion yuan, with a total GDP of 1.984348 trillion yuan in the first half of the year.
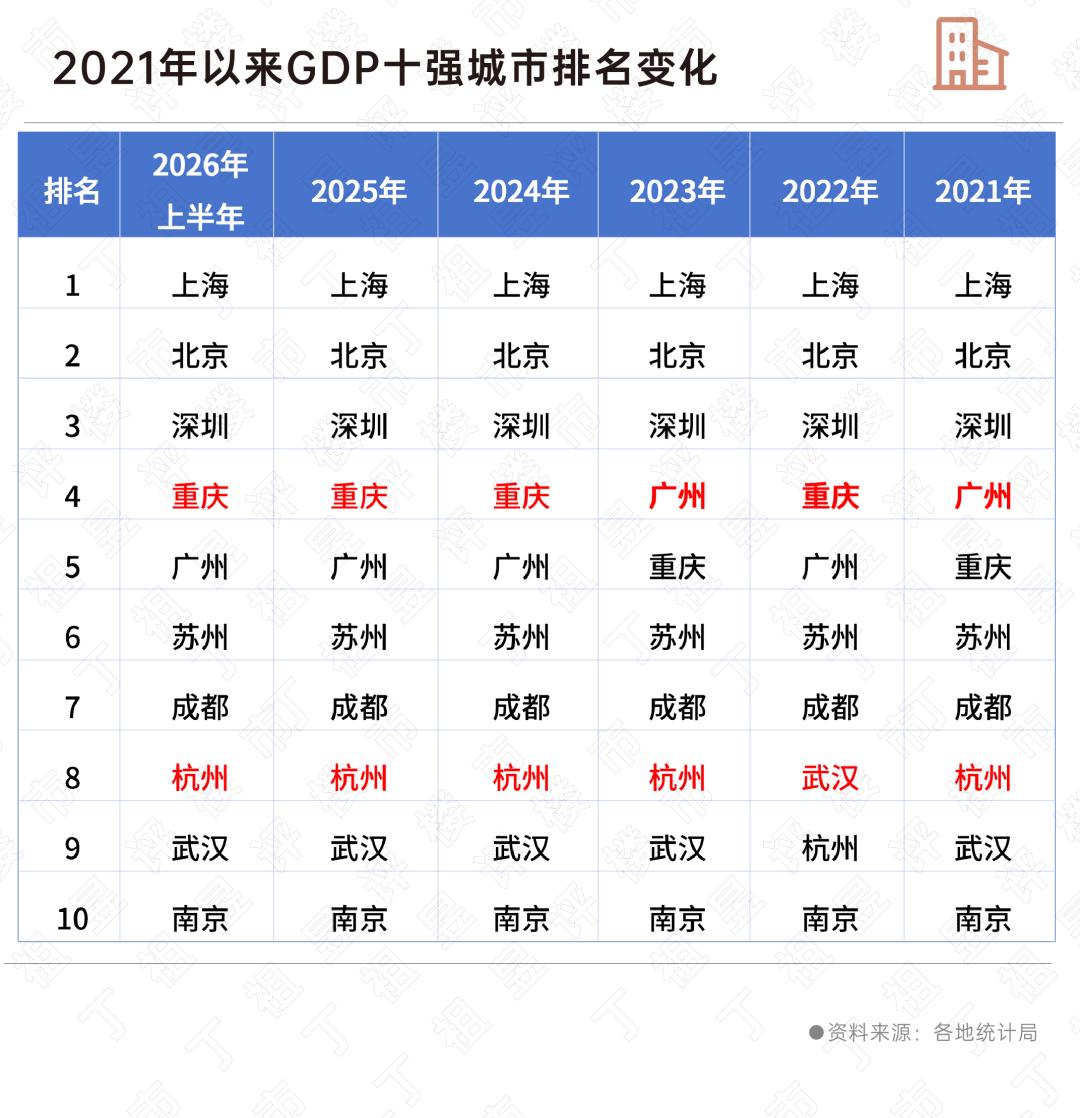
Looking at the past few years, the list of the top 10 cities in the country has hardly changed, and the head pattern is solidified. The only change is the change in ranking, namely the competition between Chongqing and Guangzhou for the “fourth city”, and the seesaw battle between Hangzhou and Wuhan for the “eighth city”.
First, let’s look at Guangzhou and Chongqing. In 2022, Chongqing overtook Guangzhou for the first time to rank fourth. In 2023, Guangzhou strongly overtook it. In 2024, Chongqing regained the fourth place. From 2025 to the first half of 2026, Chongqing has continued to maintain its leading position.
The competition between Hangzhou and Wuhan has gradually stabilized since 2023. Hangzhou has steadily ranked eighth in the country and gradually widened the gap with Wuhan.
From the perspective of location, the Yangtze River Delta accounts for four of the top 10 cities: Shanghai, Suzhou, Hangzhou, and Nanjing. There is no doubt that the Yangtze River Delta is still the “ballast stone” and “leader” in the national economic structure.
02
Focusing on the real estate market performance of the top 10 GDP cities, although GDP scale is still an important measure of urban development, it is no longer the only indicator of the real estate market.
So, what is the real estate market situation of the top 10 GDP cities like?
In terms of market capacity, Chengdu has the highest transaction area of new and second-hand houses in the first 7 months, with a total transaction volume of 18.77 million square meters, the transaction area of new and second-hand houses in Shanghai is 15.88 million square meters.
In terms of the transaction value of new and second-hand houses, Shanghai leads by a large margin, with the total transaction value of new and second-hand houses in the first 7 months reaching 841.783 billion yuan, which is higher than the sum of the transaction value of Beijing and Shenzhen, which rank second and third, by the total transaction value of Wuhan.
In addition, the total transaction value of Chengdu, Guangzhou and Hangzhou is also above 200 billion yuan.
It is worth noting that the total transaction volume of new and second-hand houses in Shanghai, Beijing, Guangzhou and Nanjing has achieved positive year-on-year growth. Nanjing’s growth rate is relatively obvious, which is mainly driven by new home transactions. In the first 7 months, Nanjing’s new home transactions increased by 31% year-on-year, while the cumulative year-on-year second-hand home transactions in the same period decreased by 1% slightly.
The transaction value of new and second-hand houses in Shenzhen increased by 2.4% year-on-year, making it the only city among the top 10 GDP cities to achieve positive growth.
From the perspective of land transaction, among the top 10 cities by GDP in the first half of the year, 8 cities are among the top 10 cities by land transaction value in the first half of the year, among which, Shanghai, which ranks first in GDP, also ranks first in the country in land transaction value in the first half of the year. While Hangzhou, which ranks eighth in GDP, ranks second in land transaction value in the first half of the year.
In terms of growth rate, Shenzhen ranks first among the top 10 GDP cities with a year-on-year growth of 218%, and Guangzhou ranks second with a growth rate of 47%, these two cities are also the only two cities among the top 10 GDP cities that have achieved year-on-year growth in land transaction value.
This means that the trend of market resources concentrating in high-energy-level economically strong cities has not changed, and the investment of real estate enterprises is also more concentrated in leading cities.
From the perspective of housing prices, data from the National Bureau of Statistics shows that the prices of new houses in Shanghai, Guangzhou and Shenzhen continue to recover. In June, the month-on-month growth of the three cities has lasted for several consecutive months. In particular, Shanghai’s new house prices have not seen a month-on-month decline for 83 consecutive months from August 2019 to June 2026, and its housing price resilience ranks steadily among the top of cities across the country. The new house price indices of Nanjing, Hangzhou and Wuhan also showed month-on-month growth in June, among which Hangzhou has achieved positive month-on-month growth for 4 consecutive months.
In terms of second-hand housing prices, Shanghai, Beijing, Guangzhou, Shenzhen and Chongqing have stopped falling month-on-month for at least 4 consecutive months.
Combined with the monitoring data of Puru Digital Intelligence Cloud, affected by the supply structure, the average transaction price of new houses in Hangzhou and Shenzhen increased year-on-year in the first half of the year, and the average transaction price of new houses in Chengdu, Chongqing and Suzhou is also higher than the same period of last year. However, from the perspective of the average transaction price of second-hand houses, the transaction prices of the 10 cities all fell year-on-year, the second-hand housing market is still in the stage of trading at lower prices for higher sales volume.
The top 10 GDP cities account for nearly a quarter of the national economic volume, with continuous gathering of population, industries and capital, and the underlying logic that strong cities get stronger has not changed.
From the perspective of the real estate market, even for the top 10 cities in the country, the differentiation of the property market is still intensifying. The stabilization process of the real estate market in first-tier cities is significantly faster than that of other cities, and the agglomeration of high-end industries has brought a large number of floating population and high-net-worth individuals to these cities, bringing more sufficient demand-side support to first-tier cities.
The current property market has bid farewell to the incremental era and turned to stock exploration. Combined with the “15th Five-Year Plan” for urban renewal, activating the potential of urban stock resources is one of the core tasks of urban development in the next five years, and leading cities will usher in new development opportunities.
This article is from the WeChat Official Account “Ding Zuyi Reviews the Property Market”, author: Editorial Department, published with authorization from 36Kr.