
- The country comparison spans 5.9 percentage points and forms three practical growth bands across the forecast period.
- South Korea remains 1.8 percentage points above the UK through biologics export scale and CDMO investment logic.
- The UK remains 1.2 percentage points above Germany as life sciences manufacturing support widens the adoption base.
- Germany remains 1.3 percentage points above Japan through medicinal product exports and regulated plant depth.
- Japan remains 1.6 percentage points above the USA through domestic biomanufacturing policy and PMDA digital review work.
- The USA closes the displayed range but remains a high-value adoption base through biotechnology R&D and process automation.
Comparable CAGRs can create different entry conditions because each country has a different mix of biologics manufacturing, regulatory review pressure and automation maturity. Full report coverage includes North America, Latin America, Western Europe, Eastern Europe, East Asia, South Asia & Pacific, Middle East & Africa.
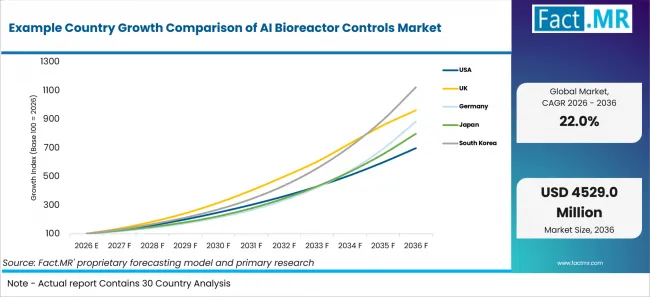
Example Country Growth Comparison Of Ai Bioreactor Controls Market | Source: Fact.MR
What supports South Korea adoption?
27.4% CAGR, supported by biologics exports and CDMO scale-up.
South Korea is projected to remain at the upper end of the profiled range as biologics exporters and CDMOs add more controlled production capacity. MOHW reported in March 2026 that biohealth exports reached USD 27.9 billion in 2025, while BIO KOREA 2026 brought 775 companies from 59 countries to Seoul in April 2026. Control vendors are expected to benefit where export programs need stable batch evidence and cleaner tech transfer.
How is the United Kingdom scaling demand?
25.6% CAGR, driven by life sciences manufacturing support.
The UK is expected to scale AI bioreactor controls as biopharmaceutical companies add digital manufacturing routines. The Office for Life Sciences reported GBP 98.9 billion in UK biopharmaceutical turnover in 2023/2024. In April 2026, DSIT announced that three companies were investing more than GBP 80 million in UK life-sciences manufacturing, with backing from the Life Sciences Innovative Manufacturing Fund.
What is supporting Germany’s adoption?
24.4% CAGR, supported by medicinal product exports and regulated plant depth.
Germany is anticipated to remain a strong Western European market because pharmaceutical exporters require repeatable process control and validated data. Eurostat reported in April 2026 that Germany exported EUR 67.9 billion of medicinal and pharmaceutical products to non-EU countries in 2025. That export base is expected to keep automation decisions tied to documentation quality and process stability.
How does Japan perform?
23.1% CAGR, led by biomanufacturing policy and PMDA digital work.
Japan is estimated to grow as domestic biopharmaceutical manufacturing policy expands. METI stated on January 1, 2025, that it would promote the building of domestic manufacturing bases for biopharmaceuticals, while PMDA formulated its Action Plan for the Use of AI in Operations on September 26, 2025.
What supports USA adoption?
21.5% CAGR, backed by biotechnology R&D and process automation.
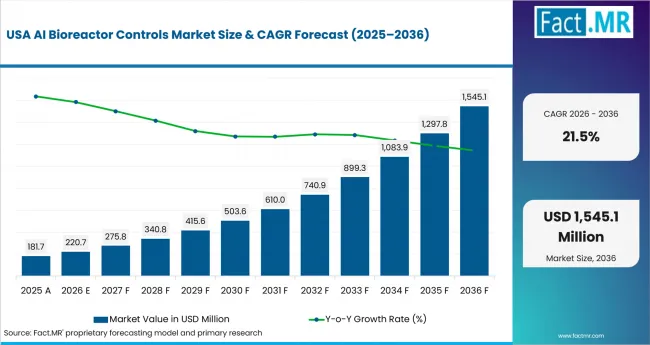
Ai Bioreactor Controls Market Country Value Analysis | Source: Fact.MR
The USA is forecast to remain a high-value market because biotechnology R&D is concentrated inside pharmaceutical and medicine manufacturing. NCSES reported in July 2025 that biotechnology business R&D accounted for 17% of U.S. business R&D in 2022, with 75% performed within pharmaceuticals and medicine manufacturing. Adoption is expected to favor systems that prove yield and documentation gains under GMP review.