
Recent Price Movement and Market Context
On 29 May 2026, ACGL closed at ₹1,901.30, down 3.00% from the previous close of ₹1,960.05. The stock traded within a range of ₹1,882.25 to ₹1,979.95 during the day, reflecting heightened volatility. Despite this dip, the stock remains comfortably above its 52-week low of ₹1,410.50, though still some distance from its 52-week high of ₹2,349.00. This price action suggests a consolidation phase following a period of strong gains.
Technical Trend Evolution
The technical trend for ACGL has shifted from mildly bullish to sideways, signalling a pause in upward momentum. This is corroborated by the daily moving averages, which currently indicate a mildly bearish stance. The stock’s short-term moving averages have begun to flatten and slightly turn downwards, suggesting that recent buying interest is waning.
MACD Analysis
The Moving Average Convergence Divergence (MACD) indicator presents a mixed scenario. On the weekly chart, the MACD remains bullish, indicating that the medium-term momentum is still positive. However, the monthly MACD has turned mildly bearish, signalling that longer-term momentum is weakening. This divergence between weekly and monthly MACD readings highlights the stock’s current indecision and the potential for a correction or sideways consolidation.
RSI Signals
The Relative Strength Index (RSI) further emphasises this mixed momentum. The weekly RSI is neutral, showing no clear signal of overbought or oversold conditions. Conversely, the monthly RSI is bearish, suggesting that the stock has been under selling pressure over the longer term. This bearish monthly RSI aligns with the mildly bearish monthly MACD, reinforcing the cautionary tone for investors with a longer investment horizon.
Bollinger Bands and Volatility
Bollinger Bands on both weekly and monthly charts are mildly bullish, indicating that despite the sideways price action, volatility remains contained and the stock is trading near the upper band. This could imply that while momentum has slowed, there remains underlying strength that could support a breakout if positive catalysts emerge.
KST and Dow Theory Perspectives
The Know Sure Thing (KST) indicator is bullish on both weekly and monthly timeframes, suggesting that momentum oscillators favour a positive outlook. Meanwhile, Dow Theory readings are mixed: mildly bearish on the weekly scale but mildly bullish monthly. This divergence again points to a stock in transition, with short-term caution balanced by longer-term optimism.
Volume and On-Balance Volume (OBV)
Volume-based indicators such as On-Balance Volume (OBV) lack clear signals on both weekly and monthly charts, indicating that volume trends have not decisively confirmed price movements. This absence of volume confirmation adds to the sideways technical narrative, as price moves without strong volume support tend to be less sustainable.
Comparative Returns and Market Positioning
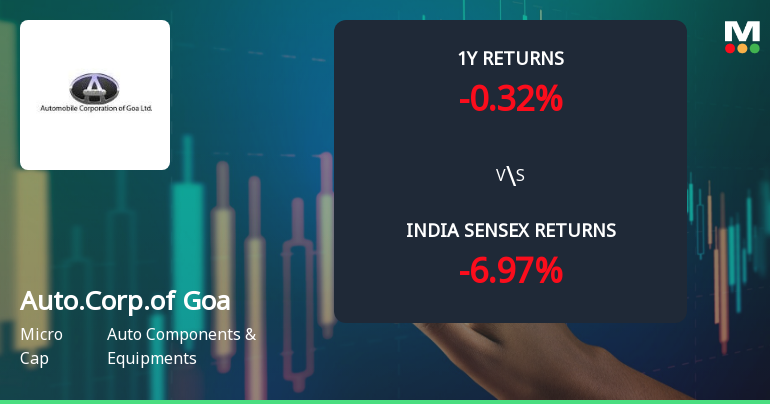
ACGL’s returns have outperformed the Sensex over multiple time horizons, underscoring its strong relative performance despite recent technical caution. Year-to-date, the stock has gained 8.38%, while the Sensex has declined by 10.97%. Over three and five years, ACGL’s returns have been particularly impressive at 142.70% and 414.00% respectively, dwarfing the Sensex’s 21.39% and 48.43% gains. Even on a 10-year basis, ACGL’s 326.06% return significantly exceeds the Sensex’s 184.64%.
Mojo Score and Rating Upgrade
Reflecting these mixed but improving fundamentals, ACGL’s MarketsMOJO score currently stands at 57.0, with a Mojo Grade upgraded from Sell to Hold as of 20 April 2026. This upgrade signals a cautious optimism among analysts, recognising the stock’s resilience and potential while acknowledging the recent technical momentum shift to sideways.
Outlook and Investor Considerations
Investors should note that the mildly bearish daily moving averages and bearish monthly RSI suggest that short-term downside risks remain. However, the bullish weekly MACD and KST indicators, along with mildly bullish Bollinger Bands, indicate that the stock is not in a full downtrend and may be consolidating before a potential resumption of upward momentum.
Given the micro-cap status of ACGL and its sector exposure to Auto Components & Equipments, volatility is to be expected. The stock’s recent price correction of 3.00% on the day of analysis may represent a healthy pullback rather than a trend reversal. Investors with a medium to long-term horizon may find the current sideways phase an opportunity to accumulate, while short-term traders should exercise caution and watch for confirmation from volume and momentum indicators.
Summary
Automobile Corporation Of Goa Ltd is currently navigating a technical inflection point characterised by a shift from mild bullishness to sideways momentum. The mixed signals from key technical indicators such as MACD, RSI, moving averages, and Bollinger Bands suggest a period of consolidation. While short-term caution is warranted due to mildly bearish daily moving averages and monthly RSI, the weekly bullish momentum indicators and strong relative returns versus the Sensex provide a foundation for potential recovery.
Investors should monitor volume trends and momentum oscillators closely for signs of renewed strength or further weakness. The recent upgrade to a Hold rating by MarketsMOJO reflects this balanced outlook, recommending a measured approach to the stock in the current environment.
Get 33% Off on our 1 Year Plan – Limited Period Only! Start Today